Commodity Report: 7/25/16
Corn
At a glance:
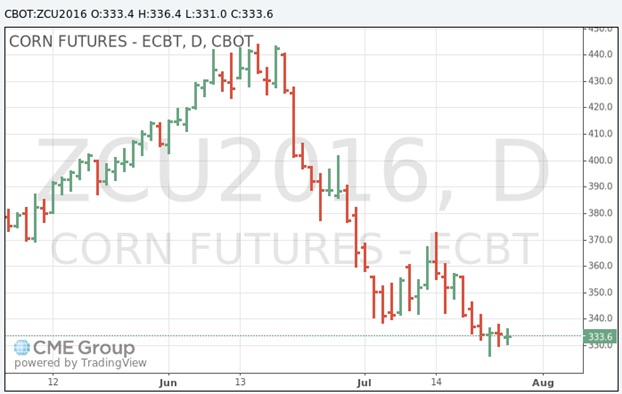
As we look at how corn prices are trending on the Chicago Mercantile Exchange we are continuing to notice a decrease in values that started in June. September Corn opened this week at $3.35 a bushel, a $0.17 cent decrease from the previous weeks opening at $3.52. While we can expect prices to continue downwards for this week we need to keep an eye on a quick turnaround with prices this low.
The Trend:
Going over crop estimation reports along with historical prices will give us a good aiming point when it comes to deciding on when we should start to secure some of our feed needs for the upcoming year. First when we look at the at the most current acreage report for the year we notice the estimated acres planted stands at 94,148,000 which is a 61,489 acre increase from 2015. This leads us to believe barring any natural disasters to the Corn Belt region that we will be having another year of record corn harvests. This information is what is continuing to push corn prices down and we need to be aware that a change in weather might force an increase in the price. Looking at a historical 10 year average while we are not currently at the lowest point which was in 2006 at a $2.28 average we are currently at the second lowest point, below 2007’s price of $3.39. While we can assume corn might push lower I believe it is time to look into securing a portion of your next year’s usage of corn products. While we might not be at the lowest point of the year we have reached a low enough point to where the lower corn can push is nowhere near the higher it has the potential to push if a weather or pest scare starts to show in the Corn Belt.
| Year | Corn($/bushel) | Bushels Produced |
|---|---|---|
| 2006 | 2.28 | 10.5 Billion |
| 2007 | 3.39 | 13 Billion |
| 2008 | 4.78 | 12 Billion |
| 2009 | 3.75 | 13.1 Billion |
| 2010 | 3.83 | 12.4 Billion |
| 2011 | 6.01 | 12.3 Billion |
| 2012 | 6.67 | 10.8 Billion |
| 2013 | 6.15 | 13.8 Billion |
| 2014 | 4.11 | 14.2 Billion |
| 2015 | 3.70 | 13.6 Billion |
| 2016 | N/A | N/A |
Soybeans
At a glance:
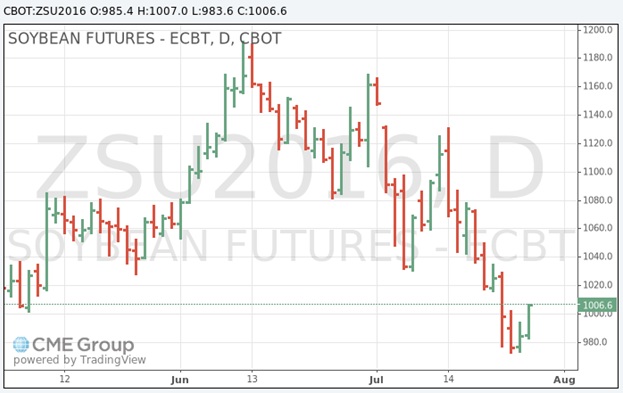
When we look at the prices being given to us by the Chicago Mercantile Exchange we are finally starting to see a decrease in what seemed like inflated value due to concerns from Argentina and exports over the past couple of months. September Soybeans opened up at $9.91 this Monday a $0.64 decrease from the previous Monday’s value of $10.55. With this in mind we can stay optimistic at a continued lowering of the price but keep in mind there is also a considerable upside with the high being at $11.81 a bushel from late in June.
The Trend:
Going over crop estimation reports along with historical prices will give us a good aiming point when it comes to deciding on when we should start to secure some of our feed needs for the upcoming year. First when we look at the at the most current acreage report for the year we notice the estimated acres to be harvested stands at 83,037,000 acres of soybeans which will be an increase of 1,223,000 compared to last year’s number of 81,814,000 acres harvested. This trend leads us to believe we will be at least keeping up if not exceeding the recent trend over the last couple of years of having record soybean crops. With this in mind we can hope to see prices falling into an average of the previous 2 years if not lower. This will probably make anything bought while soybeans are lower than $10.00 a bushel a good buy considering there is currently equal room for both an increase in price and a lowering of price in the upcoming months and year. This leads to me to believe we are currently are in a nice middle ground where we can secure some product without paying the high premiums we’ve seen earlier in the year and might still see come back later in the year, while also holding out hope that we will see more of a decrease in the coming weeks.
| Year | Soybeans ($/bushel) | Bushels Produced |
|---|---|---|
| 2006 | 5.65 | 3.2 Billion |
| 2007 | 7.75 | 2.68 Billion |
| 2008 | 11.32 | 2.97 Billion |
| 2009 | 10.05 | 3.36 Billion |
| 2010 | 9.97 | 3.33 Billion |
| 2011 | 12.52 | 3.1 Billion |
| 2012 | 13.95 | 3.04 Billion |
| 2013 | 14.07 | 3.36 Billion |
| 2014 | 12.48 | 3.93 Billion |
| 2015 | 9.49 | 3.39 Billion |
| 2016 | N/A | N/A |